
Gold set a new all-time high of $5,595 per ounce in January 2026, capping a run that began in 2024 and accelerated through 2025. Behind the price is a convergence of sovereign demand, dollar uncertainty, and a mining sector generating record margins at production costs well below current metal prices.
May 29, 2026 | Micro Math Capital Research
The Price Move in Context
Gold began 2025 at approximately $2,624 per ounce. By end of year it was trading near $4,550. It set record highs at a pace of roughly one per week. In January 2026 it crossed $5,000 for the first time, reaching $5,595 intraday on January 29 before pulling back. As of May 2026 it is trading between $4,450 and $4,775.
To place that in a longer frame: in 2016 gold was at $1,250 per ounce. An investor who held physical gold from that point to end-2025 tripled their capital. Over the trailing 12 months to early 2026, gold has been the best-performing major asset class, approximately doubling the return of the S&P 500 over the same period.
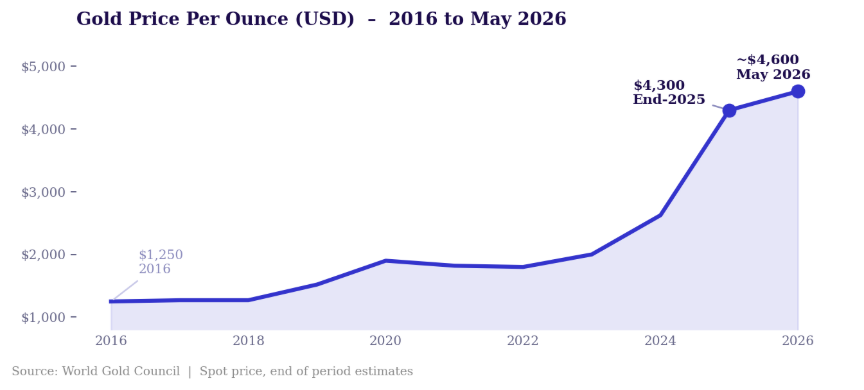
Gold’s decade-long move from $1,250 in 2016 to an all-time high of $5,595 in January 2026.
This is not a single-cause move. The rally has been driven by sovereign reserve behaviour, monetary policy dynamics, geopolitical risk, and a structural shift in institutional allocation. Each of those drivers is independently material.
Central Bank Demand: The Structural Floor
The most important structural shift in the gold market over the past decade has been central bank behaviour. Gold reserves reached an estimated $5.2 trillion in value by end-2025, surpassing foreign holdings of US Treasuries for the first time in decades. Gold now represents roughly a 20 percent share of global reserves.
The purchasing pattern has been sustained and broad-based. Central banks added 166 tonnes in Q2 2025 alone, a pace approximately 41 percent above historical norms. China’s PBOC added to holdings for seven consecutive months through May 2025, reaching 2,296 tonnes. Turkey expanded to 623 tonnes and mandated commercial banks to hold 20 percent of reserves in gold. India’s RBI added 72.6 tonnes in 2024, reaching 879.6 tonnes by March 2025. Russia holds 2,329 tonnes.
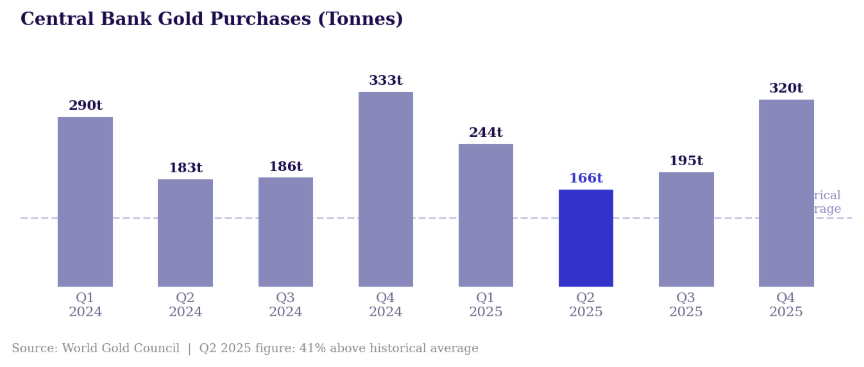
Central bank gold purchases (tonnes), Q2 2025 ran 41% above historical average. Source: World Gold Council.
A World Gold Council survey found 95 percent of central bank respondents expected continued global gold accumulation over the following 12 months and zero anticipated any decline. Institutional purchases of this scale reflect multi-year strategic allocation decisions that are not sensitive to short-term price moves.
| $5.2T Central bank gold reserves end-2025 | 20% Share of global reserves in gold | 95% Central banks expecting continued accumulation |
Monetary Policy, the US Dollar, and Real Yields
Gold has a well-documented inverse relationship with the US dollar and real interest rates. When the dollar weakens and real yields decline, the opportunity cost of holding a non-yielding asset falls. When real yields are negative, gold provides a positive real return relative to cash.
The 2025 to 2026 rally has unfolded against growing uncertainty around US fiscal trajectory, Federal Reserve independence, and the dollar’s reserve status. Foreign central banks now hold more gold than US Treasuries. Investment demand through ETFs, bars, and coins surged 84 percent in 2025 to 2,175 tonnes, reaching an all-time high. This retail and institutional re-engagement, combined with central bank accumulation, produced a demand profile that absorbed supply increases without price weakness.
Mining Equities: Margins, Underperformance, and the Re-Rating Question
While gold bullion has delivered historic returns, mining equities have in aggregate underperformed the metal. The VanEck Gold Miners ETF (GDX) gained approximately 35 to 40 percent in 2025 against the metal’s 65 percent move. This disconnect persisted even as producer margins reached record levels.
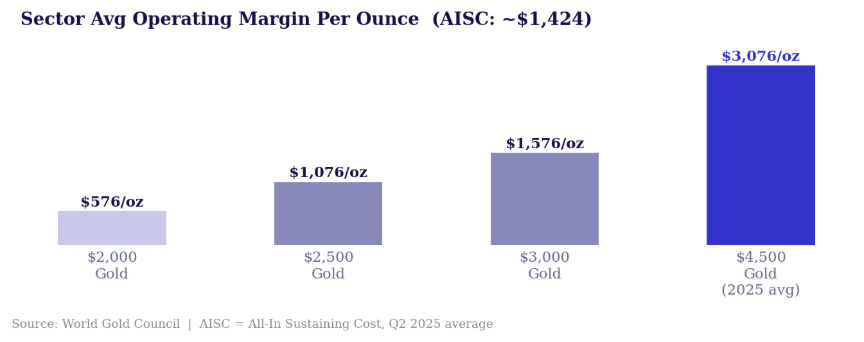
Operating margin per ounce at different gold prices, against the Q2 2025 sector average AISC of $1,424/oz.
Average all-in sustaining costs stood at approximately $1,424 per ounce in Q2 2025. With gold trading above $4,000 for most of the second half of 2025 and into 2026, operating margins for low-cost producers were in the range of $2,500 to $3,000 per ounce. Record free cash flow. Still trading at 0.6 to 0.8 times net asset value.
The sector traded at valuations more consistent with bear market conditions than a period of record operating cash flow. Agnico Eagle was up 140 percent. Barrick 175 percent. Select juniors 300 to 500 percent.
What Investors Are Watching
The key variables are the trajectory of US monetary policy and dollar strength, the pace of sovereign reserve accumulation, and the supply side. Global mine supply faces structural constraints. Regulatory hurdles limit expansion of global output. New mine development timelines measured in years mean supply responses to higher prices are slow to materialize.
Gold remains a liquid, globally priced asset with multiple access points: physical bullion, ETFs backed by physical gold, senior producer equities, royalty and streaming companies, and junior exploration stocks. Each carries a different risk and return profile, and each responds differently to the underlying commodity price. The structural demand case, built on central bank accumulation and investment re-engagement, is independent of speculative positioning. That foundation is what distinguishes this cycle from prior ones.
Published by Micro Math Capital for information only, not investment advice or a recommendation to buy or sell any security. Information is from public sources believed reliable but not guaranteed, and investing carries risk including possible total loss, so do your own research and consult a licensed advisor. This is independent editorial commentary; Micro Math Capital was not compensated and none of the companies mentioned is a client.
micromathcapital.com
Meta: Gold hit $5,595 in 2026. A look at central bank demand, the weaker dollar, and why mining equities still trade below their margins.