
Silver reached a new all-time high of $121.62 per ounce in January 2026, closing a 45-year chapter that began with the Hunt brothers. A five-year supply deficit, surging industrial demand from energy and technology sectors, and Chinese export controls from January 2026 all played a role.
May 29, 2026 | Micro Math Capital Research
The Price Move in Context
Silver opened 2025 at approximately $30 per ounce. It shattered its 45-year record of $49.95, a ceiling that had stood since January 1980, when it crossed that level in October 2025. By year end it was near $74 per ounce, a gain of roughly 148 percent. In January 2026 it crossed $100 for the first time in recorded history before reaching $121.62 intraday on January 29. As of May 2026, it is trading between $70 and $90 following a sharp pullback driven by geopolitical developments and the Fed holding rates steady.
That performance substantially outpaced gold’s 65 percent gain in 2025. Silver’s dual role as both monetary asset and industrial commodity means its price response tends to be more pronounced than gold’s when both drivers fire simultaneously. The gold-to-silver ratio compressed from 107:1 in April 2025 to below 55:1 by December, its lowest since 2013.
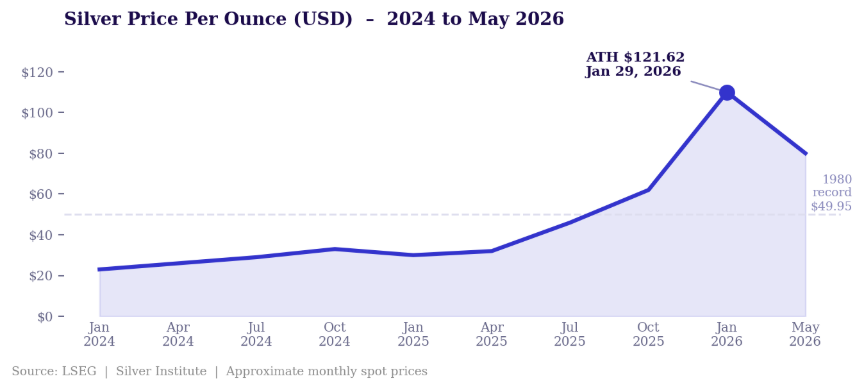
Silver’s move from $30 in January 2025 to an all-time high of $121.62 in January 2026, with the 1980 Hunt brothers record broken in October 2025.
| 148% Silver return calendar year 2025 | $121.62 All-time high Jan 29, 2026 | 55:1 Gold/silver ratio Dec 2025 low |
The Structural Supply Deficit
The silver market recorded its fifth consecutive annual supply deficit in 2025, estimated at 40.3 million ounces. The 2026 deficit is projected to widen to 46.3 million ounces. Unlike many commodity deficits that attract a supply response through new mine development, silver’s supply is structurally constrained in a way that is not easily resolved by higher prices.
Approximately 70 to 80 percent of global silver production is generated as a byproduct of base metals mining: principally copper, lead, zinc, and gold. Production decisions are made on the economics of those primary metals, not on the silver price. New standalone silver projects are rare. The lead time from exploration to production is measured in years. The result is an inelastic supply curve.
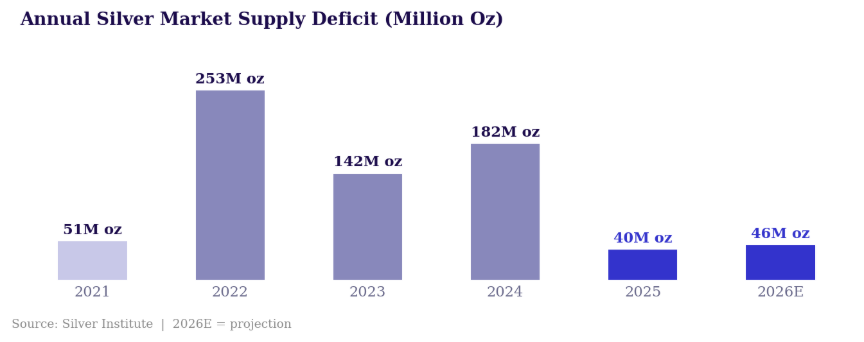
Annual silver market supply deficit (million oz), five consecutive years of shortfall, with the deficit projected to widen in 2026. Source: Silver Institute.
Even at $100 per ounce, a rapid supply response is structurally difficult to deliver. That is an unusual dynamic for a metal trading at these prices.
China added a further constraint on January 1, 2026, replacing its silver export quota system with an approval-based licensing regime and narrowing the pool of eligible exporters to 44 companies. As much as 70 percent of globally traded mined silver passes through China at some stage of processing, making this policy shift a material supply-side development. The United States separately classified silver as a critical mineral.
Industrial Demand: The Technology Layer
Industrial applications account for approximately 59 percent of total global silver consumption. This share has grown consistently as the metal has become embedded in a widening range of technology and energy applications where substitution is technically difficult due to silver’s unmatched electrical and thermal conductivity.
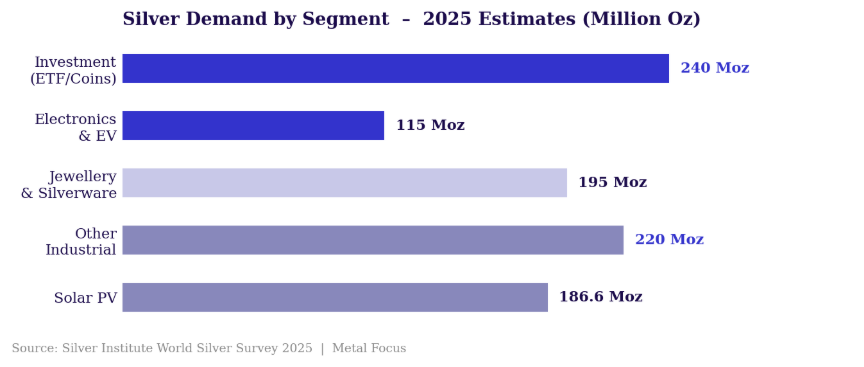
Silver demand by segment, 2025 estimates. Investment and electronics demand are growing; solar PV demand declined 6% in 2025 due to thrifting. Source: Silver Institute / Metal Focus.
Solar PV panels are the largest single source of industrial demand growth over the past decade. However, sustained high prices have accelerated thrifting by manufacturers. PV-related demand declined approximately 6 percent in 2025 to 186.6 million ounces and is projected to fall a further 19 percent in 2026. This is a meaningful compositional shift investors should understand.
Offsetting PV contraction: AI data center applications, electric vehicles, high-speed transmission hardware, and power grid infrastructure are all growing. Automotive silver demand is projected to grow at 3.4 percent compound annually between 2025 and 2031, with EVs overtaking internal combustion engines as the primary automotive silver demand source by 2027. Total global IT power capacity has increased approximately 53 times between 2000 and 2025, and that trajectory has direct implications for silver consumption.
The Monetary Bid and Investment Flows
In environments characterised by dollar weakness, declining real yields, geopolitical uncertainty, and inflationary pressure, silver attracts investment demand that amplifies price moves already being driven by physical market tightness. The 2025 to 2026 rally has encompassed both dimensions simultaneously.
The rotation into silver from late 2025 into January 2026 triggered a physical liquidity squeeze, with constrained availability in London contributing to the price spike that culminated in the January 29 all-time high. Physical silver inventories at major exchanges have remained under pressure. Silver’s lower price point relative to gold has historically made it more accessible to retail investors, and retail participation has been a visible component of the recent rally.
What We Are Watching
The key variables are the pace of industrial thrifting relative to the growth of new technology demand vectors, the practical implementation of China’s export licensing regime, the trajectory of the gold-to-silver ratio, and the broader macroeconomic environment for precious metals.
Silver remains a volatile asset. The pullback from $121 to the current $70 to $90 range illustrates the price swings possible when speculative capital rotates quickly. The structural supply deficit provides a fundamental underpinning independent of speculative positioning. But investors in this market should assess position sizing against the volatility profile, not just against the supply and demand fundamentals. For equity exposure, the relevant framework is cost structure, jurisdictional risk, and production growth visibility. Primary silver producers are scarce given the byproduct-dominated supply structure and carry a different risk profile than diversified base metal producers with silver credits.
Published by Micro Math Capital for information only, not investment advice or a recommendation to buy or sell any security. Information is from public sources believed reliable but not guaranteed, and investing carries risk including possible total loss, so do your own research and consult a licensed advisor. This is independent editorial commentary; Micro Math Capital was not compensated and none of the companies mentioned is a client.
micromathcapital.com
Meta: Silver reached $121.62 in 2026. Inside the five-year supply deficit, industrial demand, and China’s export controls on the white metal.